A few people have been asking for some more details about the principal components in the previous post, so strap in for some more graphy goodness. We’ll even dive a bit deeper into the weeds by looking at the third and fourth principal components for each league, taking our level of explained variation just above 50%.
Before we begin however, it’s worth raising a few important caveats from discussions I’ve seen.
These data sets are extremely messy (as is to be expected from a dice based game).
Nothing I have explored looks at how a race should be played (ie. comparing game statistics to game outcomes) only how they are played in any individual league.
REBBL
I’ll try and explain the REBBL plots in a bit of detail, and then just post the plaots for the other leagues while pointing out some interesting differences.
## Warning: package 'bindrcpp' was built under R version 3.4.4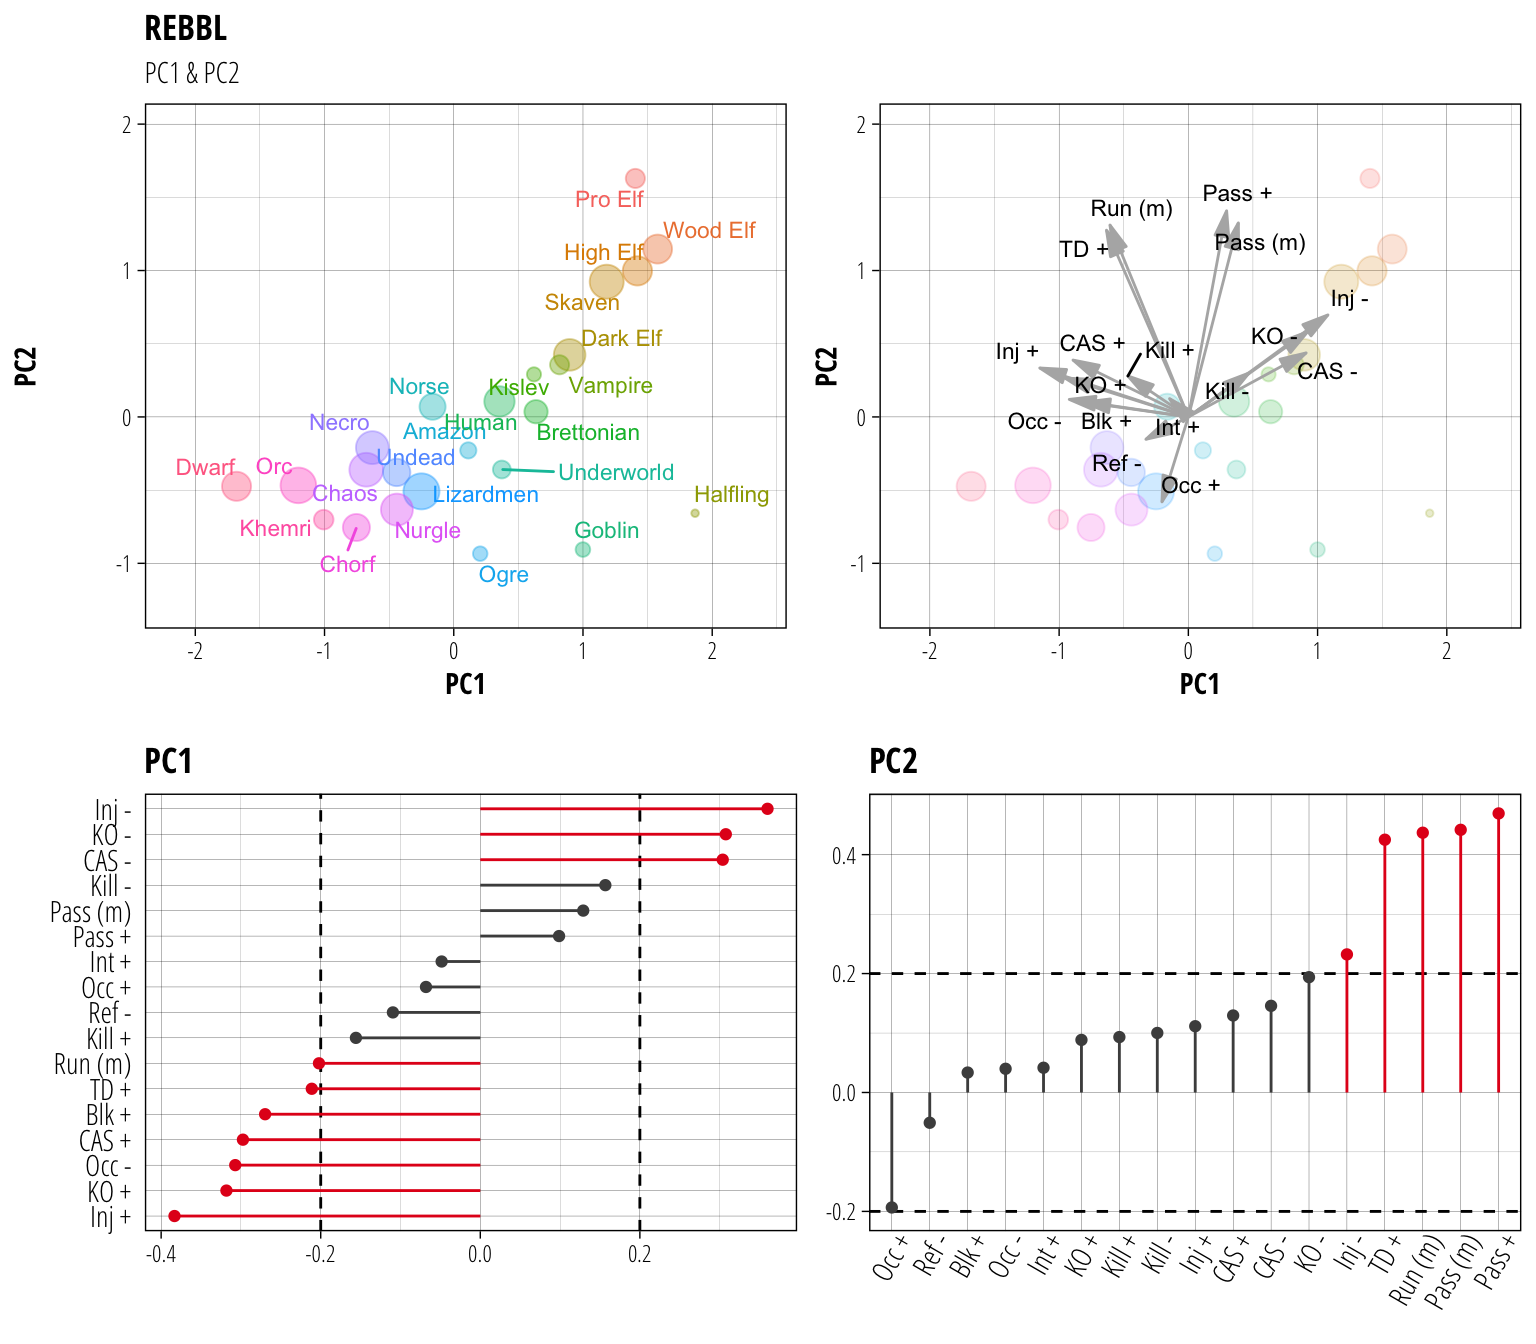
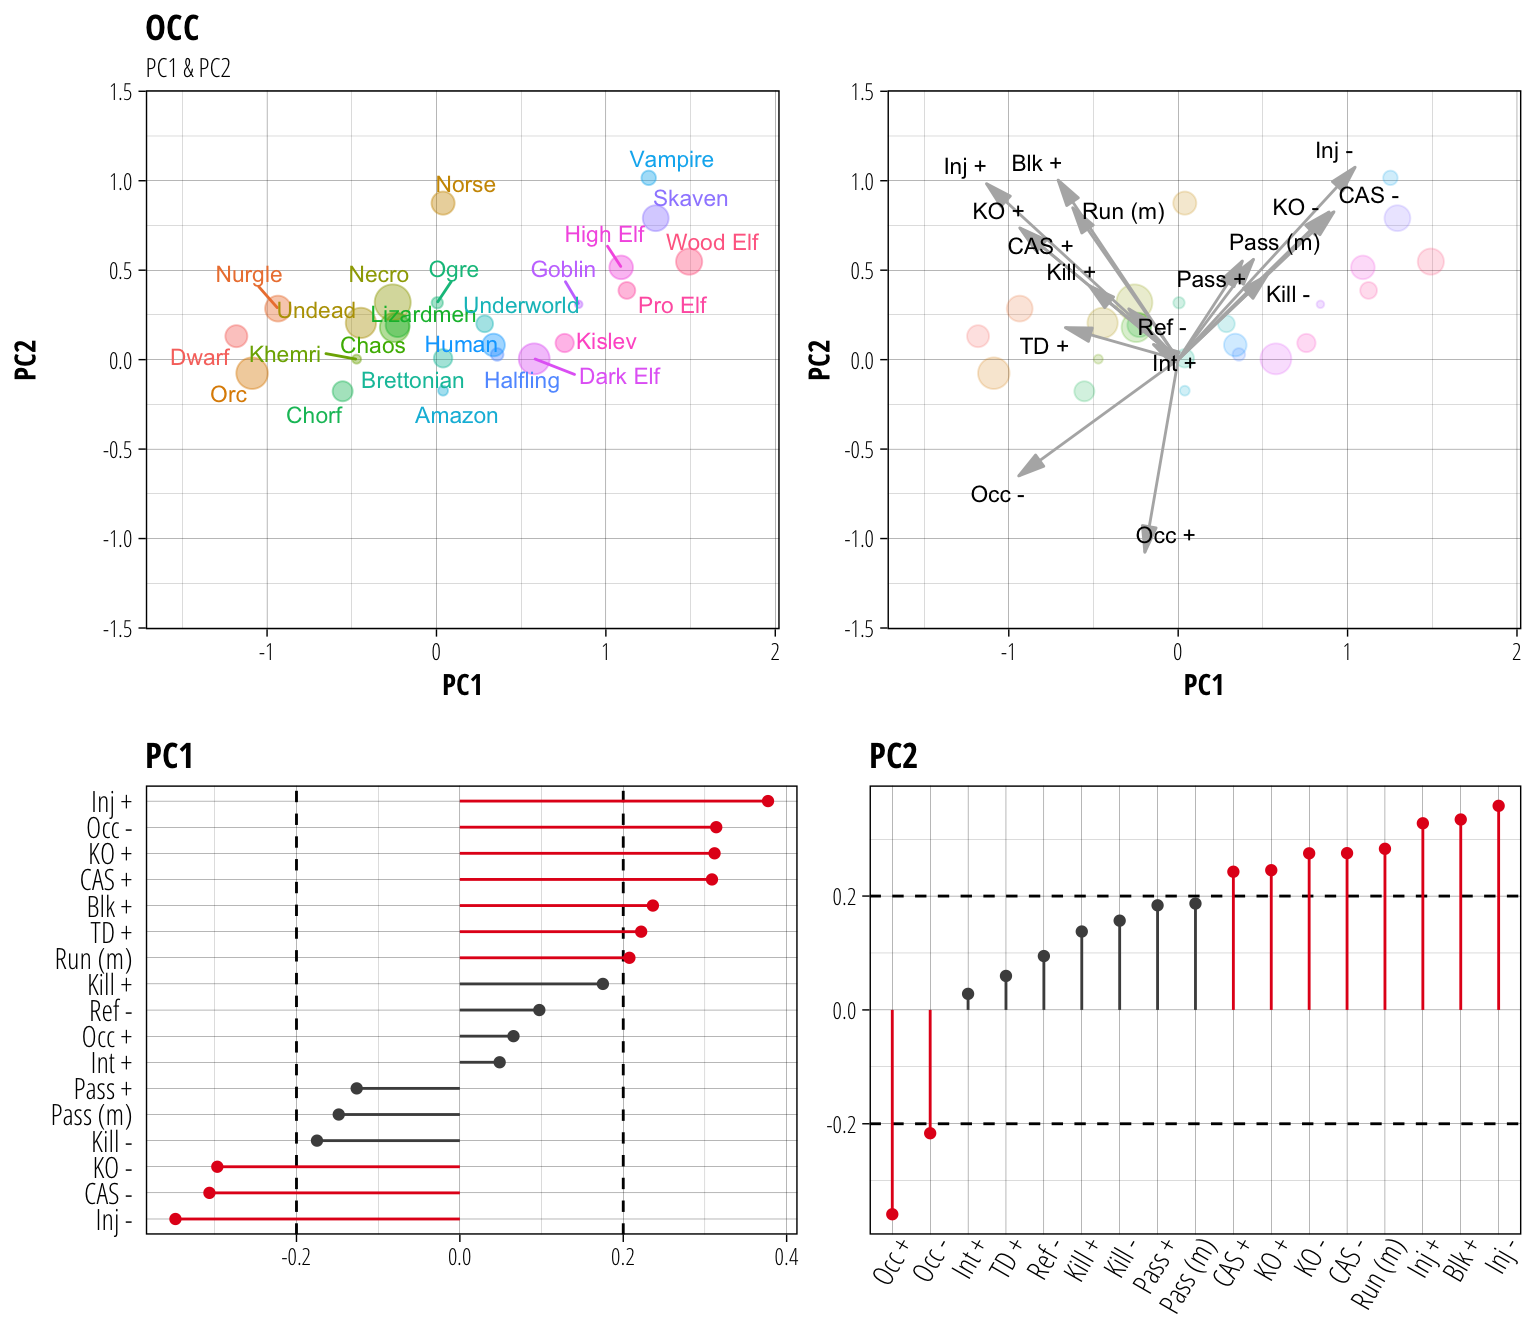
The top left part of this figure should look familiar. It’s the same as that used in the previous post and shows the median position of games from each race along the first two principal components. The top right part of the figure then overlays the relative contribution of each (standardised) individual game stat to the position of each game.1 These arrows show the direction and relative magnitude that a point would be pushed in by an increase in the indicated statistic (keeping all the other game statistics constant). For example, taking more injuries than average (Inj-) will push a game in the direction of the elven cluster (and conversely taking fewer injuries than average will push a game in the direction of the Dwarf/Orc points).
It’s interesting to note that the touchdowns scored point (TD+) is almost perpendicular to the spread of races, suggesting that there are no major differences in the ability of each race to score touchdowns (with the exception of the stunty teams out on their own in the bottom right corner of the plot). It’s probably also worth noting that the only statistic that highly correlates with scoring touchdowns is running meters (Run (m)). The statistic that is most oriented away from touchdowns is percentage of posession in your own half (OCC+). In other words, even if you are holding the ball but your drive has stalled out before you pass the halfway line, chances are you aren’t likely to be scoring much.
The bottom half of this figure breaks it down even further by showing the contribution of each statistic to PC1 and PC2 individually. I’ve used an (arbitrary) cutoff of 0.2 to highlight some of the major statistics that contribute to each component and matched the plot orientation to the combined plot above. So statistics with a positive value on the PC1 plot (Inj-, KO-, CAS-) will all push points further to the right, while statistics with a positive value on the PC2 plot (Pass+, Pass(m), Run(m), TD+, Inj-) will push points towards the top. I probably won’t talk too much about these specifically, but have included them for people who are interested in the individual statistics and their relative contribution to each principal component.
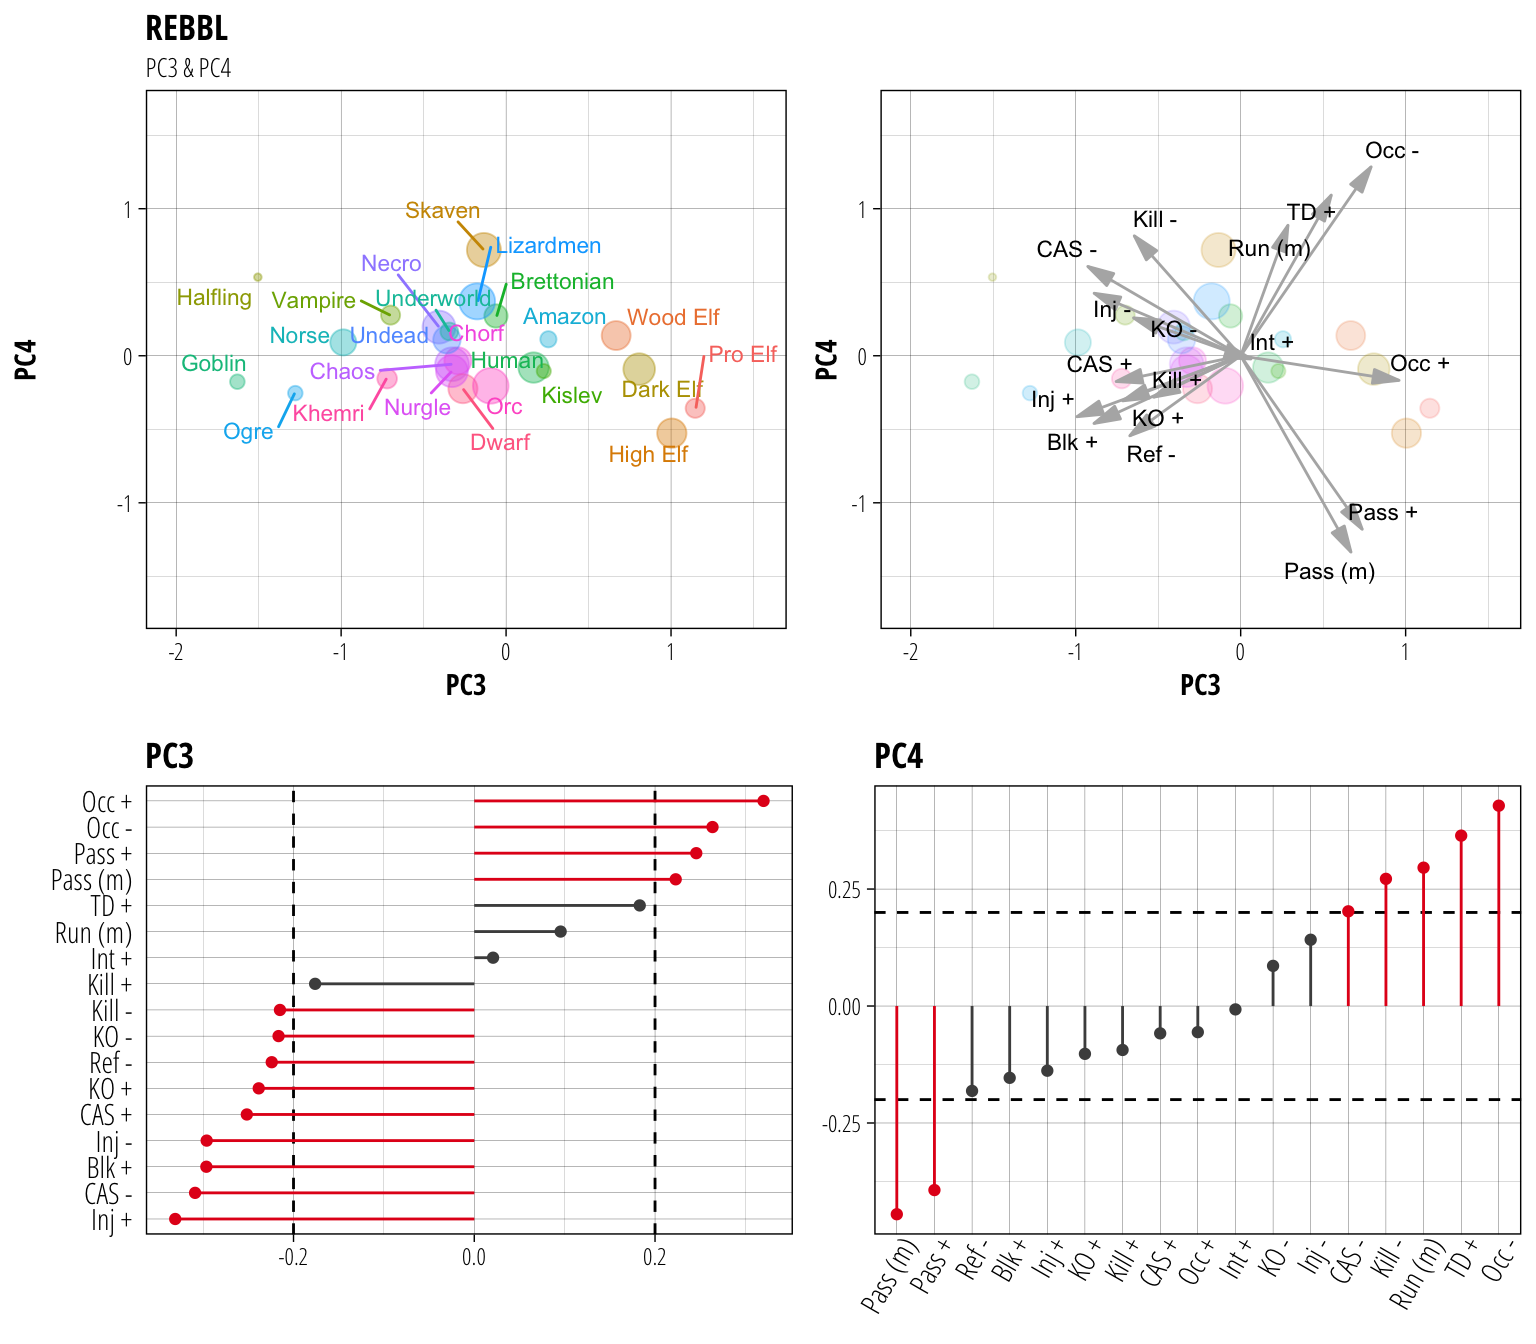
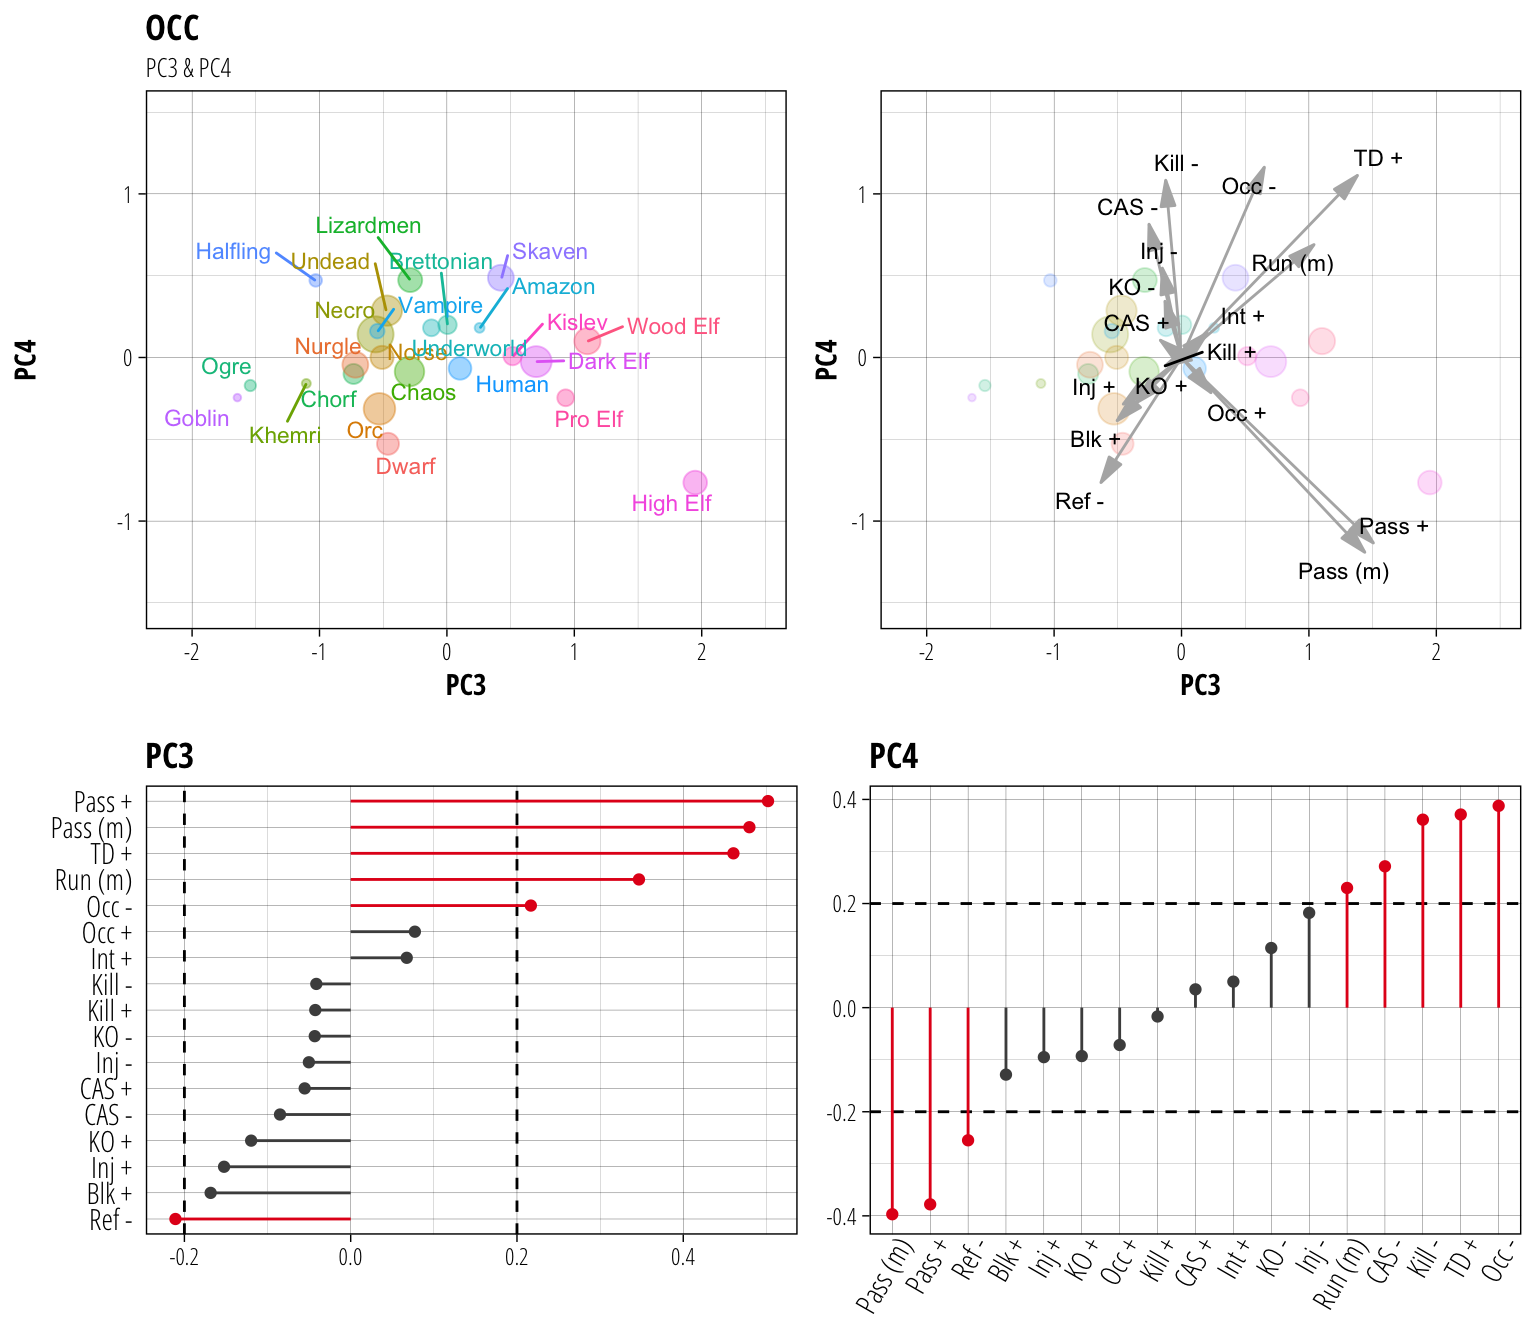
Moving on to the third and fourth components, we see a different relationship forming. The large batch of blocking skills on the left suggests that teams with high numbers of blocks/injuries both given and taken will result in a negative PC3 score. In this part of the graph we see some aggressive low armour teams that want to get mixed up in a fight but will occasionally end up on the wrong side of it. After the stunty teams it’s no surprise to see Norse as the race with the lowest PC3 score.
On the other end of the spectrum, a high PC3 score is due predominantly to posession in your own half. Here we see the elf teams cluster together, suggesting that most elven teams in REBBL like to play a deep, holding, offensive drive followed by a rapid dash to the endzone when they want to score.
For PC4, a high score is associated with higher casualties and deaths suffered, as well as a lot of running meters and touchdowns. Seeing Skaven top come out on top of this metric makes me think that my team is a major contributor to this outcome.
CCL
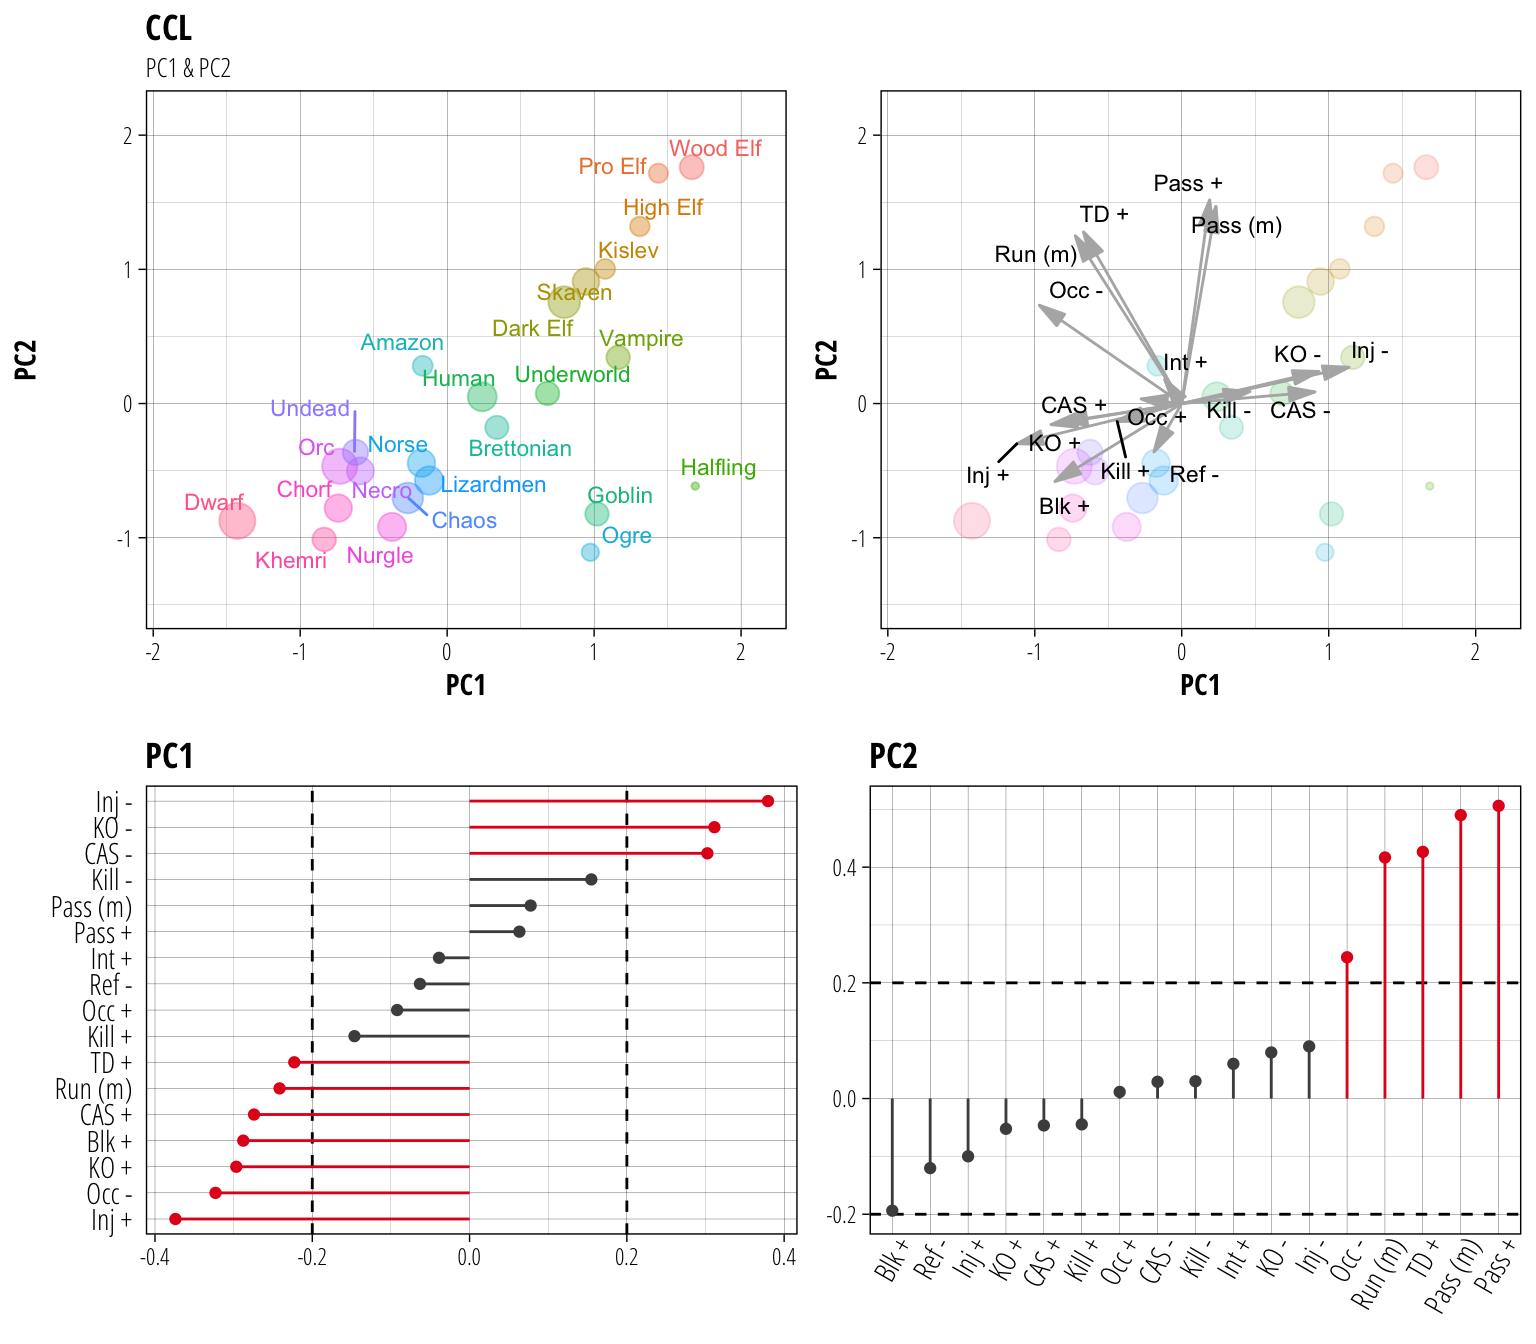
CCL seemed pretty REBBL-like in the previous post, and that remains the same looking at the individual contributions of each statistic to PC1 and PC2. One interesting difference is that occupation in the opponent’s territory has rotated around to be much closer to running meters. My interpretation of this is that in a random matchmaking environment where skill levels may vastly differ from game to game, sticking to the basics of keeping posession and grinding down the pitch is more likely to lead to a score.
OCC
OCC looked weird before, and it only gets weirder the deeper you look. I mean really, touchdowns being most associated with casualties/kills handed out in the first two PCs? Basically don’t play in OCC if you value your player’s lives.
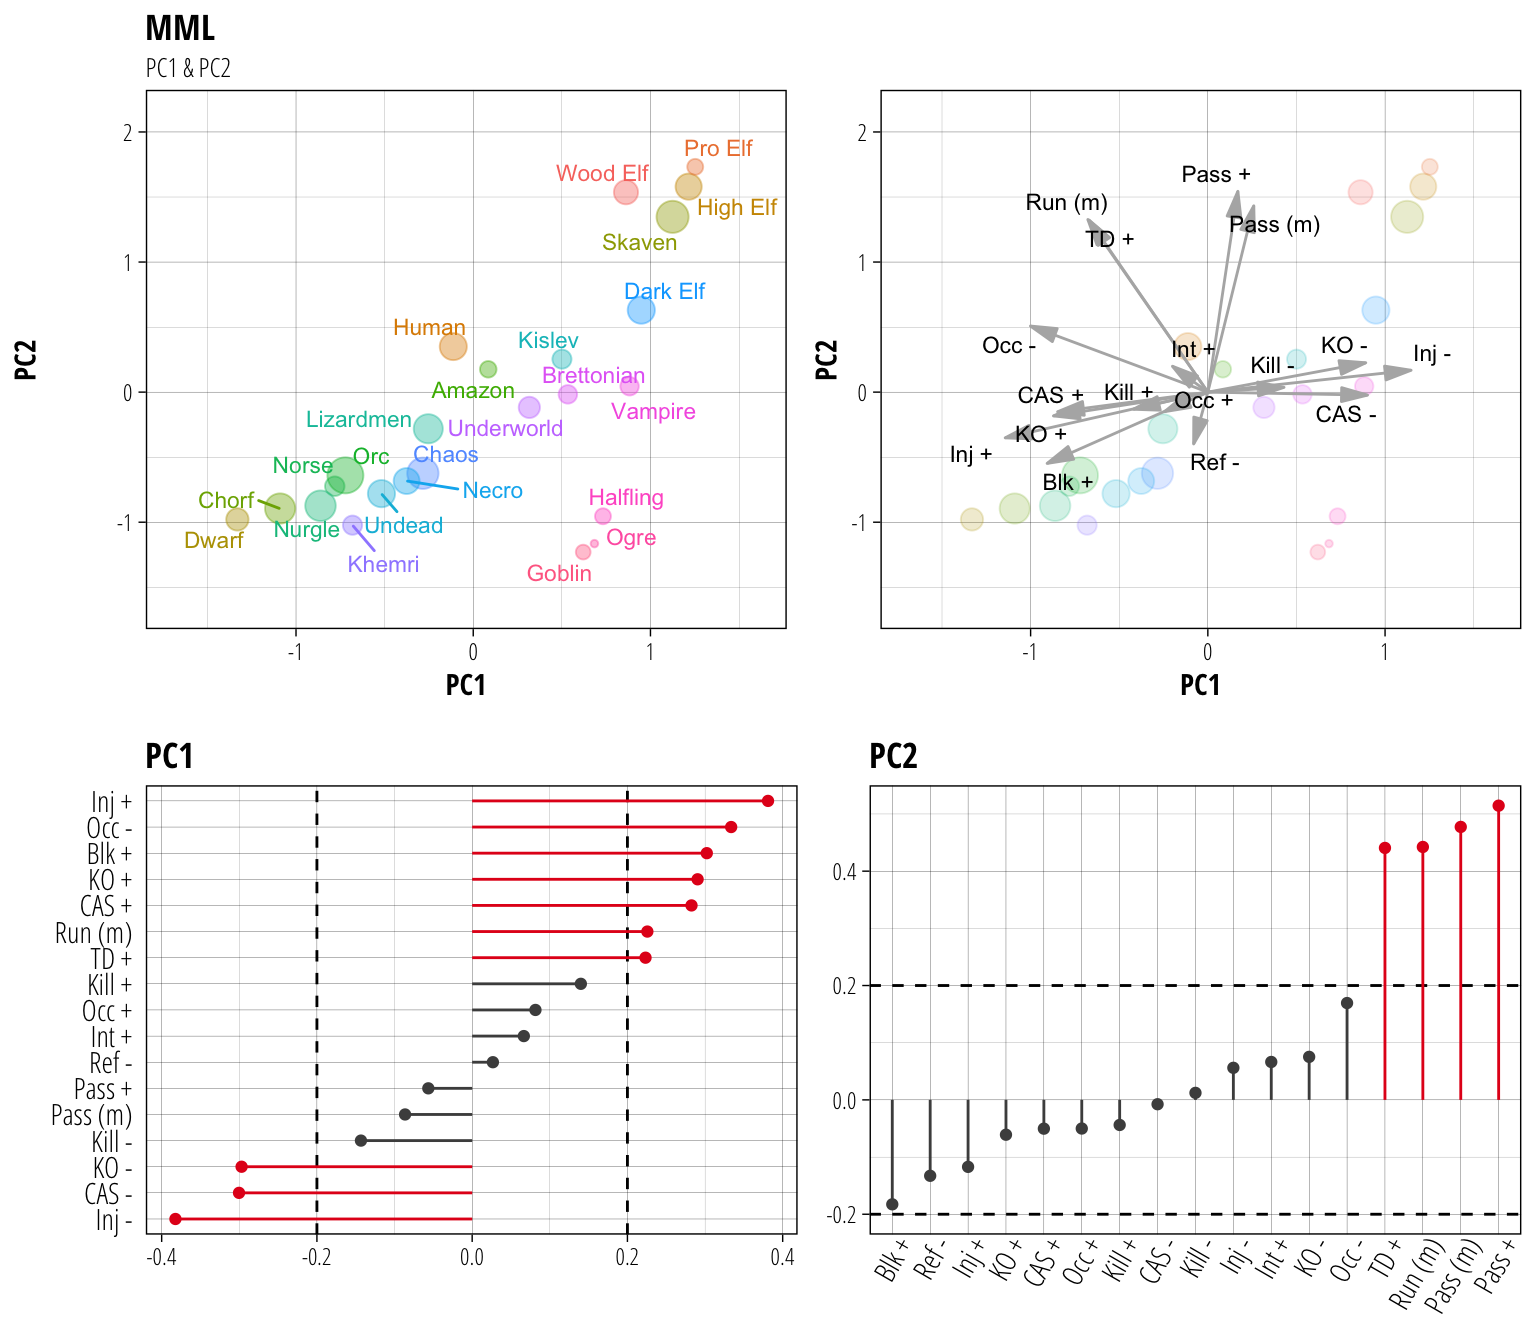
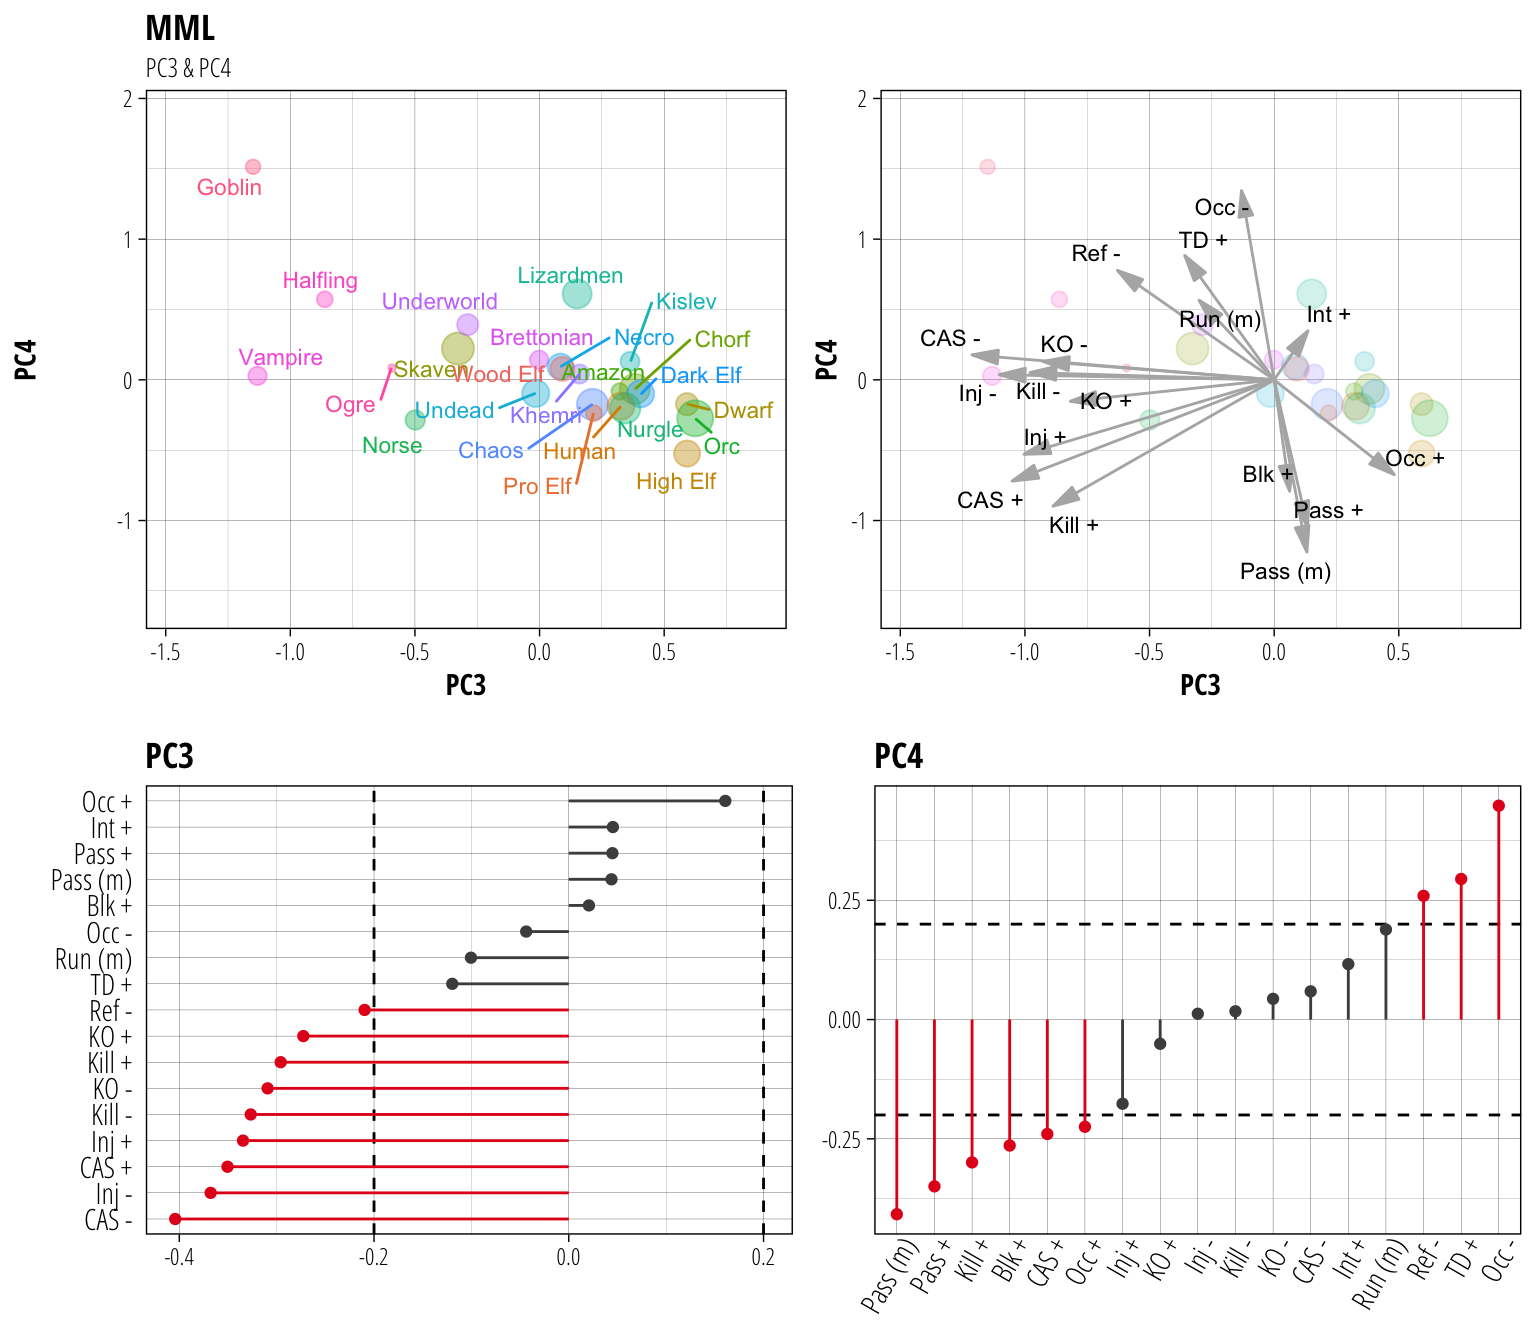
MML
Reasonably similar to REBBL/CCL and since this post is getting long enough already I will leave it up to any interested parties to do the compare and contrast.
Multiplied by a fixed amount so that they can seen on the same scale↩
Share this post
Twitter
Google+
Facebook
Reddit
LinkedIn
StumbleUpon
Email