Season predictions
OCC S1 Div2A

Since this is a game of dice and silliness, let’s try to predict the season’s results by throwing numbers around and seeing what sticks. Starting from the baseline of each team’s record to date, we will add in some information with a slightly larger sample size by using results from the Champions Ladder Season 2.
So for each individual game, we estimate the home win/tie/away win probability by using the weighted average of
- Home team’s record (25%)
- Away team’s record (25%)
- CCL2 results for games with roughly equivalent TV differences (50%)
- A small random component allowing all of these probabilities to vary each game because Nuffle
Obviously this is a massive oversimplification of the factors at play (completely ignoring a coach’s ability or a team development for example), but should provide something to think about. For each round of the season, we simulate the game outcomes using the above probabilities, update each team’s record according to the result and then repeat for the next round. Running 1000 of these simulations gives us an idea of what the ladder might look like by week nine.
With the division pretty evenly matched because of the seeding phases, there is not a huge difference between the teams when it comes to predicted point totals. Here are some frequency histograms showing the total points a team scored over each simulation run, ordered by average score (so Blood Red Skies has the highest mean score, and Natural Synergy the lowest).
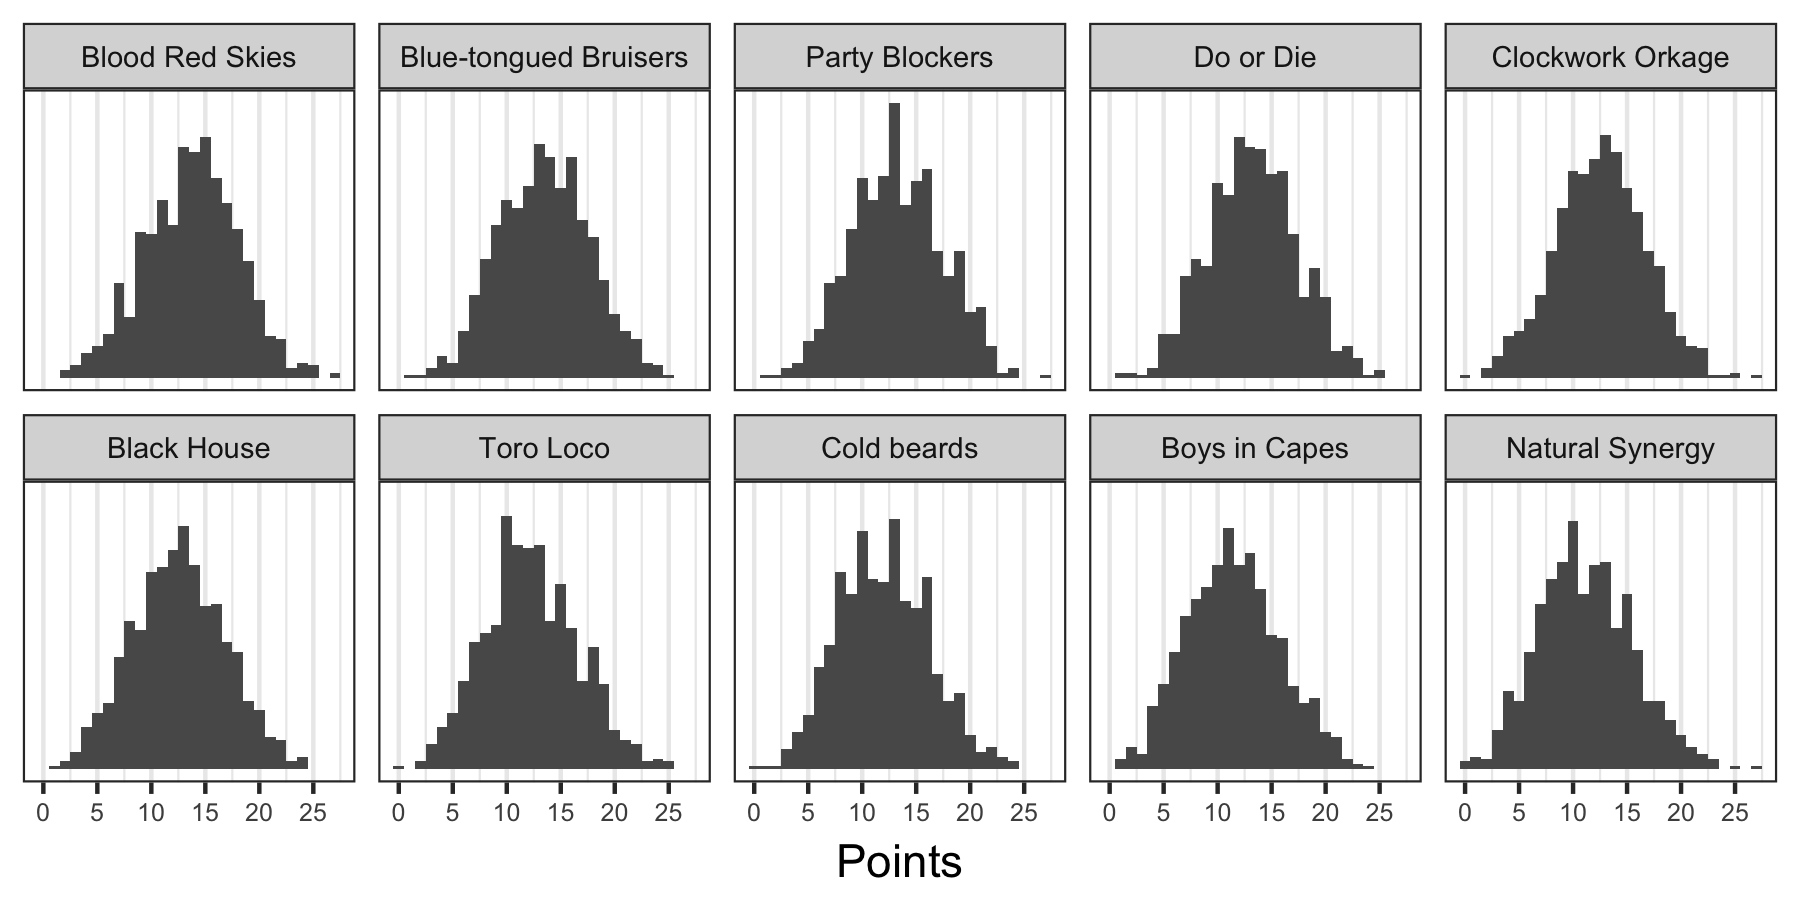
In case you are feeling a bit apprehensive about the upcoming season, the good news is that everyone is in with a chance to do well. Every team scores at least 24 points (an 8-0-1 record or equivalent) in some simulations and four teams (including Natural Synergy!) even ends up with a perfect season. Of course, the more likely outcomes fall somewhere in the middle of these distributions, with around 10-20 points for teams at the top of the table and 5-15 for those below.
Naturally, we aren’t really interested in points but ladder positions, for promotion/relegation/glory/gloating/etc. We can convert the final point score in each simulation to a ladder rank to see where teams are most likely to finish up. Here’s a heatmap of the proportion of times a team finishes the season at a particular ranking (ties determined randomly, because I’m too lazy to try simulating tiebreaker metrics like TDs scored). Darker cells indicate a higher likelihood of finishing in that position, and I have highlighted in red the most common rank/s for each team.
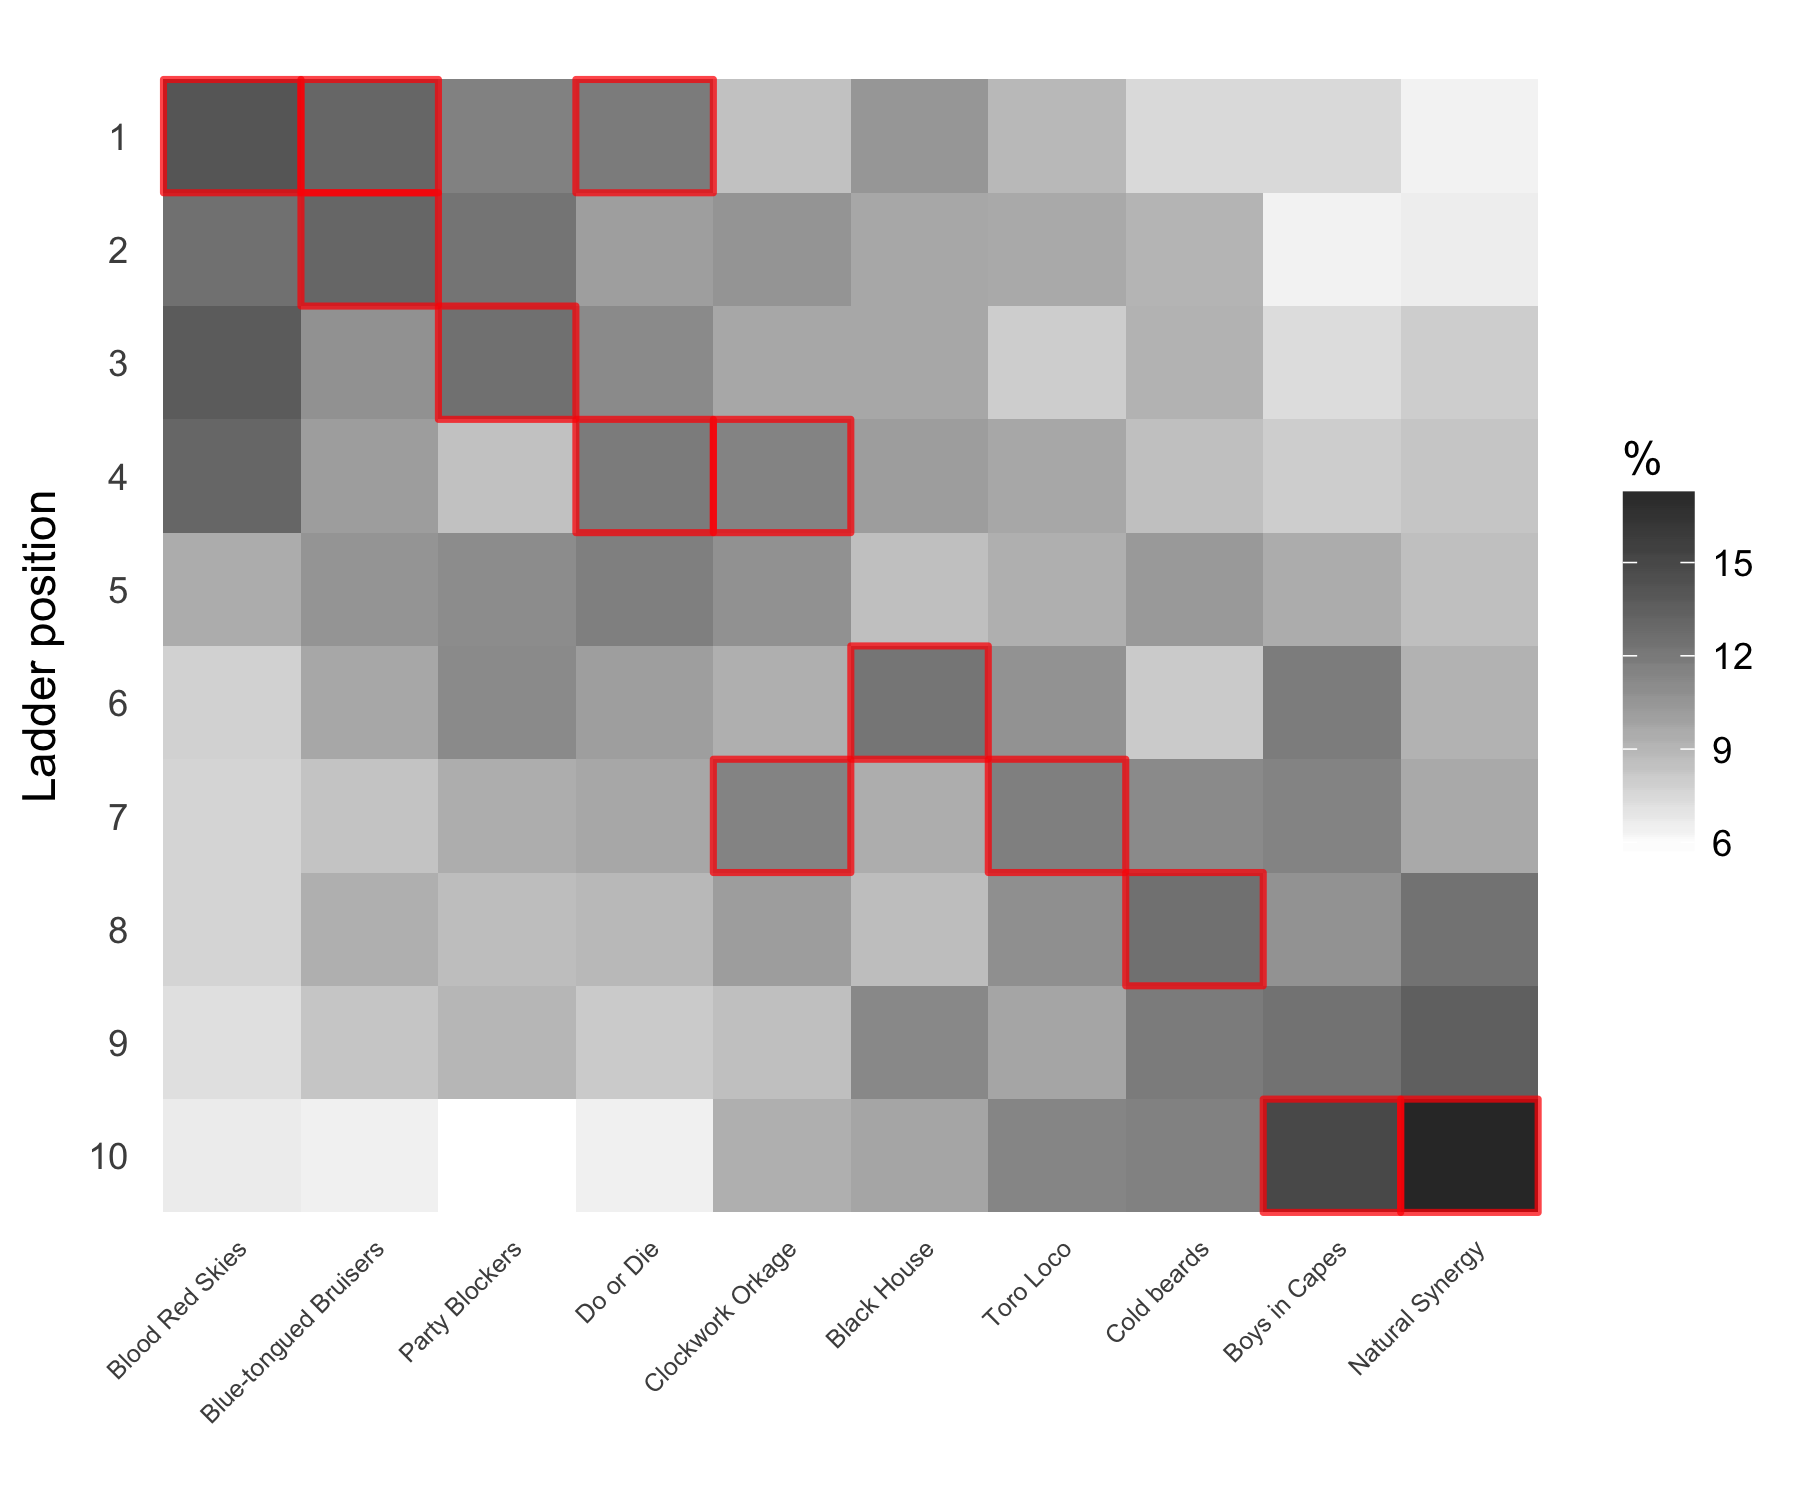
The teams are ordered left to right by average ranking, so are our best guess at finishing positions by the time round nine rolls around. There’s clearly some wide variation around those predictions however, with the top spot being the most common outcome for three teams, teams like Black House/Toro Loco having a pretty consistent likelihood to finish anywhere on the table and teams like Party Blockers with a bimodal distribution ending up either top three or somewhere around 6th. One of the few high probability predictions we can make from these simulations is that Blood Red Skies will almost certainly finish in the top 4, probably in 1st spot. So if whoever plays Mongloom in the first few rounds could do their best to damage a few key players for later rounds, you would be doing your bit to make the division much more interesting lol
Share this post
Twitter
Google+
Facebook
Reddit
LinkedIn
StumbleUpon
Email